You can optionally display and plot statistics gathered by each
monitored Radiator. Radiator gathers over 20 statistical measures for the
server as a whole, and for each Radiator object (i.e. for each Client,
Realm, Handler, AuthBy and Host in the Radiator configuration). Radar
allows you plot any or all of the available statistics from any or all
objects within a Radiator.
Plotting statistics allows you to see, for example, when Total
throughput is unusually low, or if Average response time is usually high,
indicating a problem in the authentication system. Many other interesting
and useful statistics are also available, allowing you to keep close tabs
on the health of your authentication system.
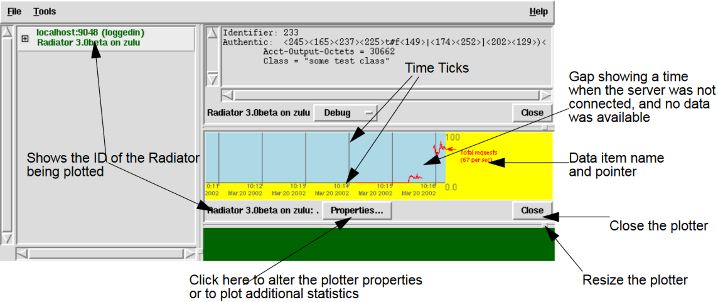
To view a plotter for a Radiator, click on the server in the server
list, then choose Tools->Plot statistics. You will see a plotter window
in the tools area, similar to
Figure 11. Viewing a Radiator statistics plot. This plotter will
show statistics gathered for the server as a whole.
To view a plotter for an object with Radiator, expand the server in the
server list by clicking on the +. The server will expand to show all the
configurable parameters and objects at that level within the server. You
can drill down to see objects embedded within other objects. For example,
to plot statistics for a single Client, click on + next to the server name
to expand it, then click on the + next to Client. It will expand to list
the name of each Client in the Radiator configuration. Click on the Client
name, then choose Tools->Plot statistics. You will see a new plotter
window in the tools area, similar to Figure 10 on page 15. This plotter
will show statistics gathered for just that Client
Figure 11. Viewing a Radiator statistics plot
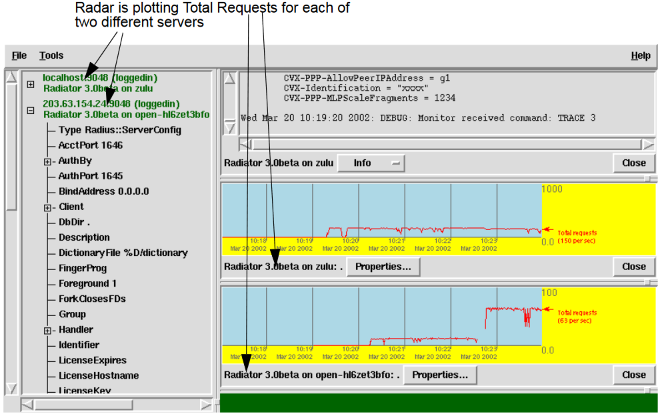
You can have any number of plotters for any number of Radiator internal
objects. For example, you could have a `Total requests' plotter for the
server as a whole, a separate `Average Response Time' plotter for the
server as a whole, a `Bad authenticators in accounting requests' for a
certain Client that is currently causing trouble, and a `Total requests'
plotter for a Host in an AuthBy RADIUS, showing how many requests are
being proxied. Furthermore, each plotter can plot any number of the
available statistics for that object at the same time. However, it is not
possible to have statistics from two different objects plotted in the same
plotter. See
Figure 12. Viewing multiple statistics plots, showing an example of Radar
plotting statistics for two different servers.
Note that if a Radar becomes disconnected or unavailable while being
plotted, the plot line for that Radiator will not be drawn while it is
disconnected. This means there may be gaps in the plot line reflecting
times when there was no statistical data available from that server. This
is normal behaviour for Radar, but the cause of the diconnection should be
investigated.
Figure 12. Viewing multiple statistics plots
For each plotter, you can extensively customize what statistics
are displayed and how they are displayed. You can add and remove data
items from the plotter, change colors and titles, and change the scale
factors and plotting frequency.
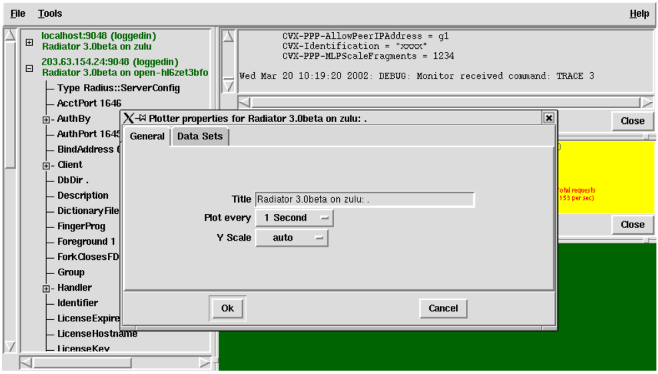
Figure 13. Changing plotter configuration General
The general tab allows you to configure the behaviour of the
plotter as a whole.
- Title: This field specifies the title to be used to label the
plotter window. It appears in the bottom left corner of the plotter
window, to the left of the Properties button. It defaults to the ID of
the server and the name of the object it is plotting.
- Plot every: Specifies how frequently statistical data is to be
retrieved from Radiator for this plot. Options range from 1 Second to 1
Day
- Y Scale: Specifies the range of the Y (vertical) scale. Options
include `auto', `0-1', 0-10', `0-100' etc. Auto means vertical scale
will be automatically chosen according to the maximum historical value
of the displayed data, so that the data fits within the vertical
scale.
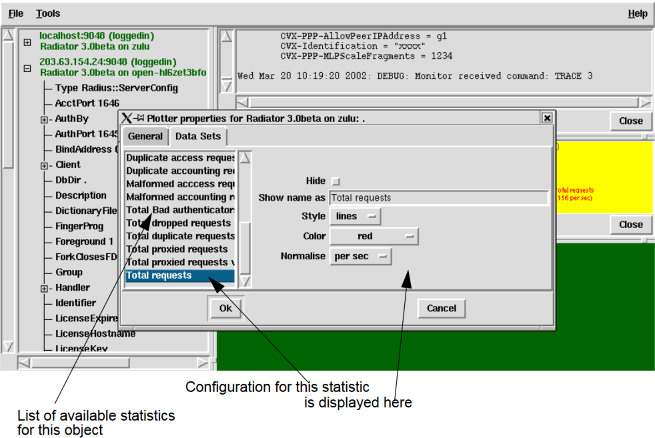
Figure 14. Changing plotter configuration Data Sets
The Data Sets tab allows you to configure the look of each individual
statistic displayed. On the left side, there is a list of available
statistics from that object. Clicking on one will show how it is
configured on the right. The following options are available
- Show: Set this to make the statistic visible in the plotter. If not
set, the statistic will not be plotted.
- Show name as: Specifies an alternative name to use for this
statistic in the plotter. Defaults to the standard Radiator name for the
statistic.
- Style: Specifies the way to display data points for this statistic.
`Lines' means join samples with lines. `Dots' means plot each data point
with a single 1 pixel dot. `Solid' mean plot the data as a filled solid
vertical bar.
- Color: Specifies the color to use to plot this data item.
- Normalise: Specifies how to normalise the data for each statistic.
Radiator provides the raw measurement of each data item. The most common
choice is `per sec' which shows the average rate per second. Other
choices include rescaling up or down by factors of 10, allowing
differently scaled statistics to be usefully plotted on the same
scale.
The plotter window can be resized vertically at any time by dragging
the adjuster in the lower left corner of the window.
Tip
There is a right mouse button menu available on the
plotting area of the plotter window. It includes a Properties button. If
you click the right mouse button close enough to a data sample, it will
show the name of the data item, and the time of the sample.